Using a Labour Curve or S-Curve
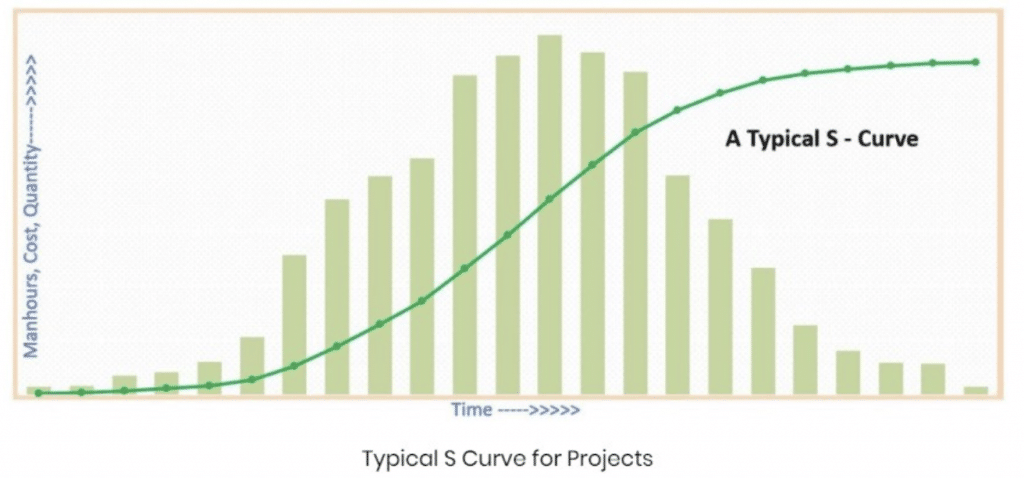
A labour curve or S-Curve is one of the major tools used in project management that tracks project progress over time. It is a graphical representation that gives the required information in a flash.
The curve represents the cumulative work done over time and hence the steepness or flatness gives us the rate of work overtime. It is clear at the initial stage you need fewer resources but in middle, we call it execution phase needs the maximum of all the resources. The end is the same as the initiation phase.

Manpower verses Labour Curve
The combination of plotting monthly labour hours verses a cumulative labour curve helps you track how you are trending to your planned estimate. By adding in a recovery plan, you can adjust monthly hours in an attempt to keep the project on schedule and within budget.

Job Costing
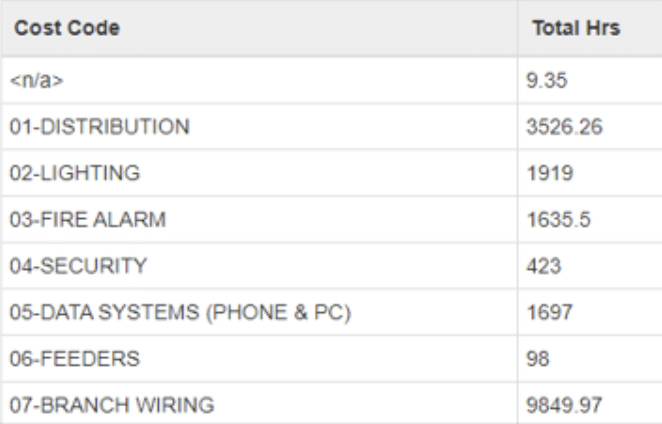
Track labour hours and billing.


Estimate vs Actual
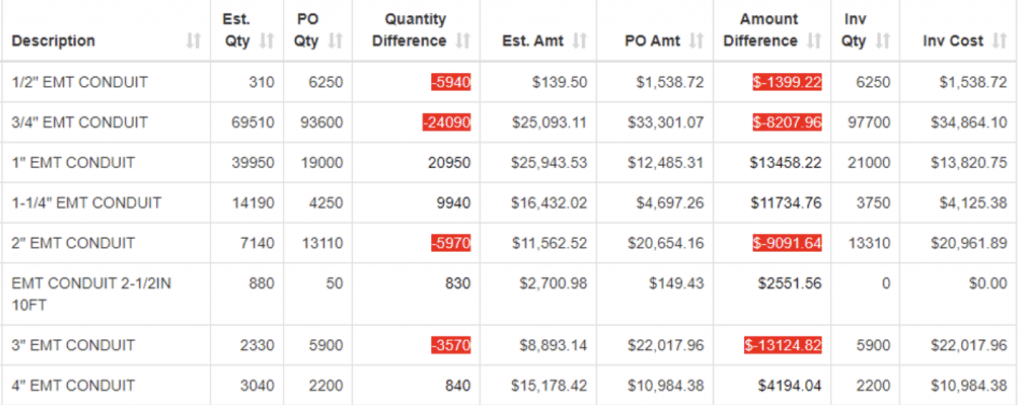
Matches estimated products to PO products and highlights variance


